Data Visuals Compilation
Compilation of data visuals used in projects (refresh page if having issues loading):
World Freedom Index
Color Scheme 1:
Color Scheme 2:
Covid US Detail
KB Model vs ESPN
KB Projected vs Actual
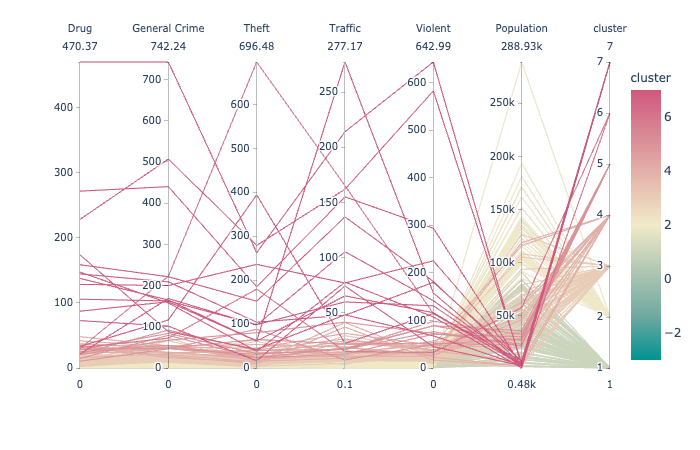
NYC Crimes
NYC Neighborhood Clustering
Draft Version
NYC Neighborhoods Latin Population Breakdown
Sankey Diagram
I thought this looked cool
White Theme
Dark Theme
NBA Team Win % Prediction Model
NBA Teams Dashboard